I was sent this chart today:
4 Likes
It probably inversely correlates with a sense of entitlement.
For once an really interesting FT report that’s not behind a paywall! Very interesting survey IMO. For once us over 60 are advantaged. But hey! Me too was also once young and care free.
2 Likes
It would be interesting to compare that chart from the covid times with a war. It look like the young got a burnout. But, before jumping to conclusions, think for a minute that’s it’s probably a long sruvey. I bet 2 beers people affected by ennui self-selected into answering the survey. People that “have to” do something in their lives may be underrepresented.
Beyond that, the digital world and the internet are just tools that amplify our capacities. They may increase our capacity to learn, or increase our capacity to waste time. Great difference between using online resources for learning and work, and doom-scrolling in twitter or facebook, or getting fed ads in instagram where everything is an ad. From this perspective, the digital world is creating great inequality among people in the world by facilitating access to what we want. There’s always winners and losers.
I don’t buy the decline in conscientiousness because smartphones and apps. The FT article linked to this other article:
Why are personality traits related to achievement in educational and occupational domains?
The personality processes involved may vary across different stages of development, and at least five candidate processes deserve research scrutiny (Roberts, 2006). First, the personality-to-achievement associations may reflect “attraction” effects or “active niche-picking,” whereby people choose educational and work experiences whose qualities are concordant with their own personalities.
For example, people who are more conscientious may prefer conventional jobs, such as accounting and farming (Gottfredson, Jones, & Holland, 1993). People who are more extraverted may prefer jobs that are described as social or enterprising, such as teaching or business management (Ackerman & Heggestad, 1997). Moreover, extraverted individuals are more likely to assume leadership roles in multiple settings (Judge, Bono, Ilies, & Gerhardt, 2002).
In fact, all of the Big Five personality traits have substantial relations with better performance when the personality predictor is appropriately aligned with work criteria (Hogan & Holland, 2003). This indicates that if people find jobs that fit with their dispositions they will experience greater levels of job performance, which should lead to greater success, tenure, and satisfaction across the life course (Judge et al., 1999).
People who are more conscientious may prefer conventional jobs, such as accounting and farming. I self-identify with that, I don’t want the spotlight, I just wanted to do something in life which was not too boring and with good income.
I grew up on the other side of the Atlantic and there’s a neurotic quest for the “best”. Being average and happy is not enough. I was not a good student because I hated sports. Apparently I had to be good at music or football to be a great student. A push to excel at everything. I read this article now and I see how society on the other side of the Atlantic pushes for extroversion since young age. Meanwhile, there’s still a bunch of things to make society work that need to be done by conscientious people.
Maybe individuals are conscientious enough, but since society rewards extroversion more. Then, the survey is answered to match these expectations. So, careful with surveys, they’re not science.
1 Like
It is to you and me. Well it is to me (and it is paradise, I admit. Gosh had I had this tool when I was younger!)
But it’s way past that. Lots of people literally live in it. Success is no longer special achievments, it’s clicks, likes and - the only thing still there - money. But the hight of wealth worth mentioning has changed too. I mean really, you’re a millionaire? ![]() Poor bugger.
Poor bugger.
The internet is a parallel world by now. You don’t even have to switch anymore - you can make your living in it. And a good one too.
With, imo, little saftisfying “work” - but hey, that is me. Don’t ask one who’s not on social media.
They do politics in there now. Politicians going back and forth via social media!
The more “common” jobs are automized, the more people will flee into that world, feeling good (or getting mobbed to the stage of being suicidial) about doing … basically nothing.
1 Like
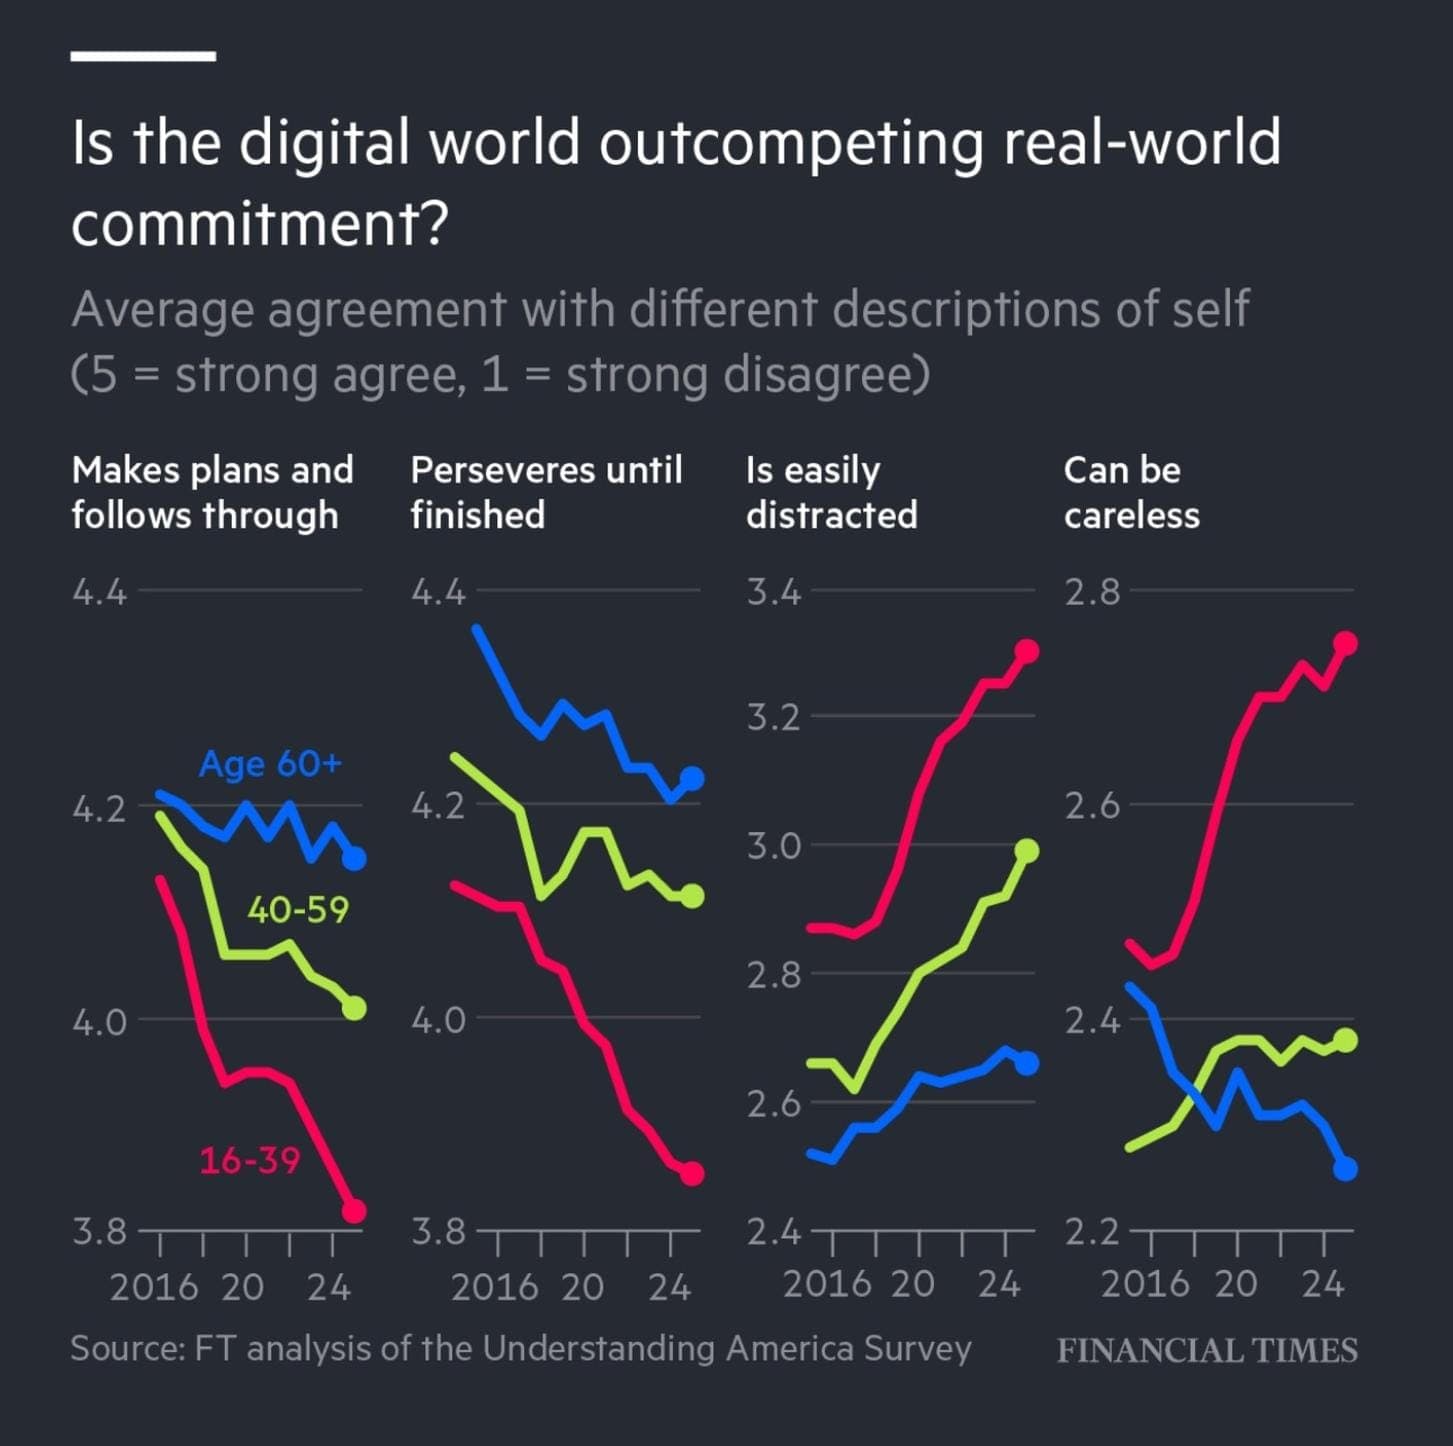
So how can you draw any conclusions from this chart without an explanation of what the vertical measure actually is? What does 4.2 mean and what does a 0.5 drop mean?
This kind of potentially misleading graphical presentations attached to some kind of righteous conclusions about how people live their lives gets my blood boiling…
P.s. and why aren’t the y axis starting at 0?
Yes, that would be one of my complaints too. The actual changes look quite small and there is no indication of how it was measured, margin of error etc etc.
I do notice attention span changes in myself. A book or film has to grab me fairly quickly or I loose patience. If I can’t find the answer to a question fairly quickly on the internet the days spent the days spent perusing books at length are gone.
Also, conscientiousness meaning responsibility and diligence, that that is going to the dogs is something my father would have complained about. That the younger generations are hopeless is a given. Whether it has really decreased substantially in the last few years I really doubt. What has changed is the pace of change. Radios and vinyl to cassette recorders to CDs and Walkmans/ ipods to streaming on a mobile phone and social media.
The information in the chart answers your questions. Maybe the reader needs to think a second or two, but anybody from among the FT’s target groups should easily be able to answer them.
So maybe you don’t qualify, which would help explain why you’re overwhelmed by this simple chart series. As the headline explains, it’s based on self-assessments with values from 5 (meaning strong agreement) to 1 (meaning strong disagreement).
The FT should do better than this. Self-assessments over a ten year period. Agree/disagree/can’t make up my mind? Pretty meaningless stuff
2 Likes
That’s an entirely different question. However your post indicates that you, too, did’t understand the charts yet you can’t keep yourself from commenting on them. I find that quite interesting.
In my opinion the charts would have been more meaningful if they’d used the same scale for all of them.
If they had put 1 to 5 on the y axis for them all it would have made direct comparisons easier and shown the size of the changes across time more clearly.
Oh I’m far from being overwhelmed dear, call me underwhelmed rather
I don’t have a problem understanding the charts, I have a problem with the conclusions being presented and the way it’s being reported. There’s a very long road from a quite small 8% drop in “persevers until finishes” in the 16-39 group and attributing that to “digital world” rather than a million other environment factors. And the main problem being that not using 0 on the y axis the graph makes appear that this measure collapses to force some kind of message
An on the methods used, how can you possibly assume that the self-reported numbers can be compared between the two groups (16-39 vs 60+)? How do you know that the younger group doesn’t evaluate itself on “being easily distracted” on different standards than the old folks - given the very high differences in education, environment and concerns they are faced with?. It may well be that the younger group is less distracted and more focused, just expects itself to be focused on the far more stimulus it is faced with
There are other more scientific and more reliable methods to measure “distraction” rather than a half-arsed self-reporting questionnaire from 1 to 5.
So let’s try to work this out again, shall we?
I tend to agree, at the very least the amount of the range depicted should be the same.
However it’s common practice to show only a small part of the entire scale like this, pretty much everybody does it and in all fields. It doesn’t make the slightest sense to pick on this single instance.
Actually you do, as you demonstrated in your first post. Either that or you’re being fundamentally dishonest. Both alternatives make a discussion pointless.
The fact that “everybody does it” doesn’t make it right
3 Likes
You would think, but in fact if you were to align all the measures on the Y axis from 1 to 5, you would imply that you can consider variations in each variable as being similar - if these variables had different distributions you would be very wrong to do that too. You’d have to control for that first if you were to do this scientifically.
But on the other hand, “follows through”, “perseveres”, “is distracted”, “can be careless” really at the end probably measure the same thing (with 2 variables inverted). So in the end it’s a moot point - the plot chose to show the same phenomenon 4 times to hammer its message
Which is just to say how bad this graph really is
I agree. This is one of the strangest lines I’ve met in my life. And how it actually keeps many in check. I always made a point on exlaiming loud and clear that I do or I don’t, what ever the case was. Guess what? People were embarrassed for me at first until they realized I wasn’t at all.
an other one of those (worse) is: If I don’t do it someone else will.
Indeed, for some people clicks and likes are more important than whatever happens in real life. But, when I was young I also had the desire to be part of something, belonging to a group. A few of the young are slaves to the likes, will they be like that after 30 YO? A few of them yes, but most will outgrow that.
The chart is made to create a narrative. The source of the narrative is a self-reported survey. I already speculated about the higher probability of bored and troubled people answering the survey online compared to other people that have to do something in their lives.
In spite of all that, the article is just an “what if?” that opens a discussion.
The elephant in the room is the old nature VS nurture debate, (genes VS education). I don’t know if the author of the article was smart enough to realize he’s supporting the side of this debate that tells education has a stronger impact on our behavior and lives than genes.
I don’t believe changes in conscientiousness can happen over a few years. That means our genes are useless jelly and we can be reared to be goats or glitter princess instead of what our genes say. Since genes did not change, all that could change is nurture or social interaction. These, could be changed once again, NBD.
If such a selector applies it applies to all, and probably equally. That makes it a likely wash.
The brain’s malleability changes with age, what’s been done may well be impossible to undo. These changes, applied to large groups, change society as a whole, so they may be impossible to undo. For future generations as well.
How do you produce Germany’s proverbial meticulousness? Nobody knows. Once lost it’s probably gone for good.