Simply stock trading

I do use that, but only if the whole market did correct. For single stocks I usually wait until it did start to raise.

In the dividend strategy I use the dividend yield (Dow U.S. dividend 100 index sorted by dividend yield) as starting point to buy a new position. But Clorox is no longer in that index and it would not pass my tests.

The report of the last 3 quarters shows a FCF payout ratio of over 100%. May be temporary but for me this is a definitive stop sign.

The chart does not look very promising at the moment. Probabilities on such a picture are big that the stock sinks further:

Addition: remember, picking lows is a losers game. To make money it is only important what a stock does after you bought it, not before.

1 Like

OK, the “sort by dividend yield” part may lead to pick a low. I got Flowers for $7.99 in April, which seems to have been at least a temporary low. But the chart does not look good. We will see:

If that stays the low I think it would be the first time ever that I did pick a low. But I trade this strategy since 2014 and it would be a big coincidence if I would never pick a low out of poor luck.

Now for partial sells (my market dividend concept) I always use a temporary high, that is wanted by this methodology. At the end cyclicals stay cyclical…

I guess if the dividend yield is good enough, then it doesn’t matter as long as they continue to pay those dividends.

Dividends are paid out of cash flow. Most people use the earnings payout ratio, but for me the FCF payout ratio is more important. Obviously the company cannot pay out more money that comes in forever.

Seems CLX’s FCF has covered their dividend most years and going forward it’s looking fine according to analyst expectations in the next couple of years (see the 2nd graph in post #280 above).

Things I don’t like:

  • earnings growth rate is a mere 4% or so over the past 20 years, completely flat or even negative if you shorten the time horizon to a decade or less
  • high (dividend) payout ratio
  • dividend CAGR has flattened to about 2.5% in the past five years or so. That’s lower than inflation in USD …
  • their earnings expectations keep getting revised downwards:

    6 months ago 2026 earnings[$] were expected to come in at $5.97 per share, 3 months ago it was down to $5.90, 1 month ago it was $5.94, now it’s a mere $5.55.
    Either the company keeps guiding downwards or the analysts keep getting more pessimistic (or both …).
    If the CFO is worth his salt, he’s been guiding the street downwards towards $5.55 in order to “beat” with, say $5.69, at the end of the fiscal year in June.
    Anyway, I prefer earnings expectations going up over the course of time.
  • They seem to have loaded up on debt: about 63% long term debt to equity.
    Admittedly, I only skimmed their latest 10-K but couldn’t find anything relevant regarding their long term debt maturity schedule … maybe this is a red herring.

Things I like:

  • 38 years of consecutive dividend years.
  • BBB credit rating
  • Brand
  • It kills COVID-19 if you drink it in sufficient amounts. [:skull_and_crossbones:]

$ Note that their fiscal year ends mid year aka end of June.

:skull_and_crossbones: Possible side effects: it might kill you, too.

1 Like

When Google acquired ITA Software in 2011 for a then staggering amount of $700 million in cash or so – I know, I know, pocket change in today’s world – one of the projects that came out of it was a freshly engineered replacement system for the clearly antiquated global computer reservation and booking system for airlines. Obviously, the 04FEB2025 date format (and all the other mainframe or earlier rooted flight related reservation and booking systems formats) needed to be disrupted by Silicon Valley!

Nothing will stand in the way of progress, please step aside!

Google managed to onboard one or two airlines to ITA’s newly developped reservation and booking system, honestly really a state-of-the-art piece of software on Google’s then internal cloud infrastructure that was already scaled for our solar system and that could have been scaled to our galaxy within a few quarters and For a Few Dollars More.

Obviously, major (or even minor) airlines wouldn’t move unless other major (or minor) airlines would move as well and unless there was interoperability with the exisiting antiquated system.

Despite probably dozens of highly paid product managers and VPs involved – my personal guess would be at least dozens of millions in SBC[$] – this slight little insight never made the top of the priorities list for “migrating the global flight systems over to Google” and hence … well, we’re still stuck with 04FEB2025.

As a result, we have Google Flights (which is awesome), but IMO not worth a $700 million upgrade from then existing systems like Kayak (and others).

In some standard company’s acquisition history, this might have been the end of the acquiring company. In Google’s unlicenced and unlimited ad money printing machine the acquisition was a mere blip on the radar lightening up a couple hundred millions of cash in one 360° turn of the radar detector.


Log recorded: 02MAY2026


$ SBC – Stock Based Compensation.

1 Like

If it ain’t broke…

2 Likes

Actually the official log format was DD-MON-YYYY (with dashes). To save some bytes it was stored without the dashes. I liked that, was probably what I liked most in that whole business and I still use it today when several language or cultural groups may need to interpret the date.

1 Like

Next up (in the series of going through my stock picks):
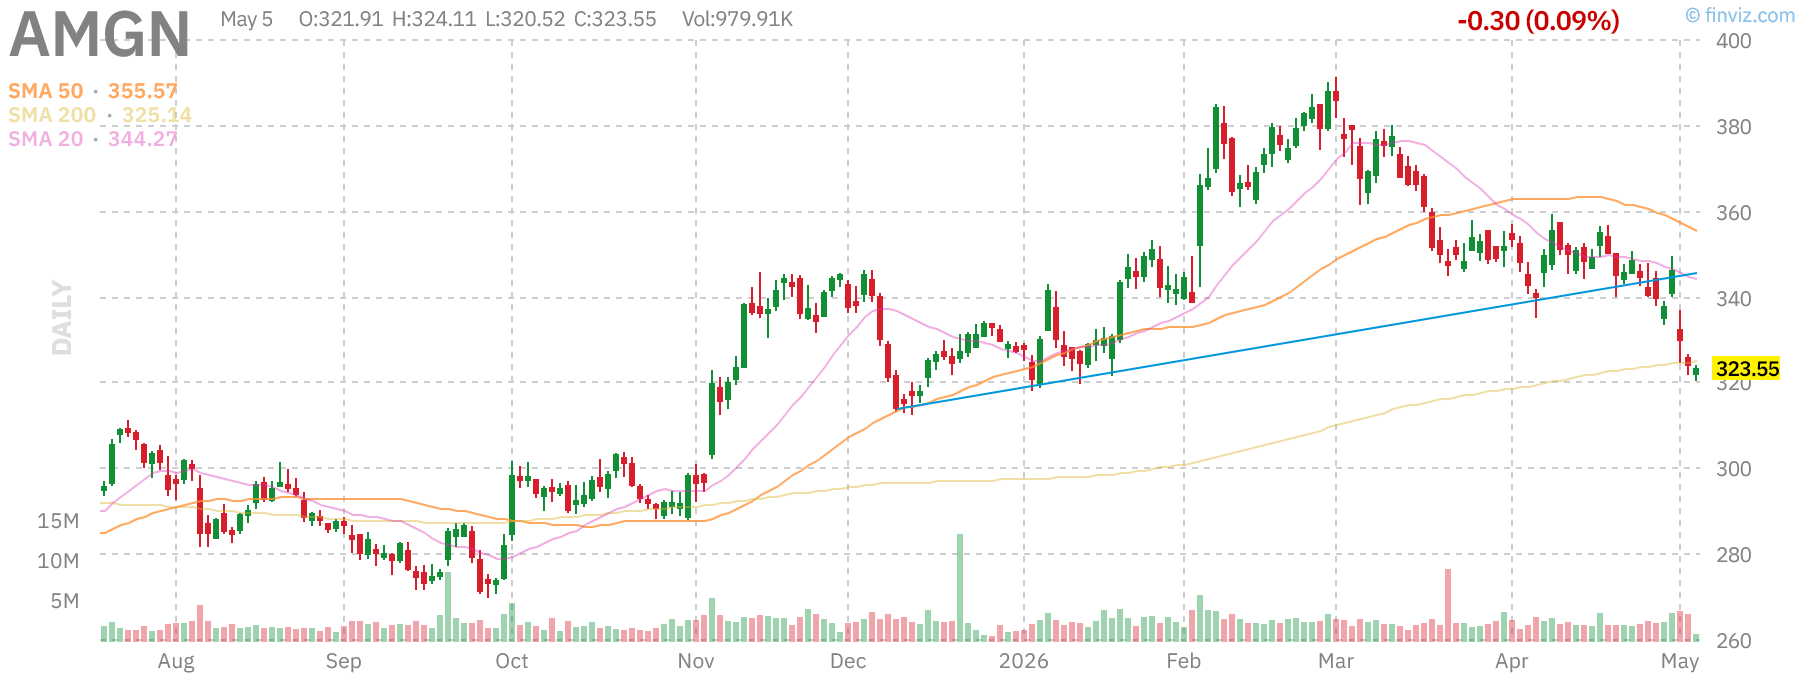

AMGN

Amgen, Inc. is a biotechnology company, which engages in the discovery, development, manufacture, and marketing of human therapeutics. For company profile details see footnote.[1]
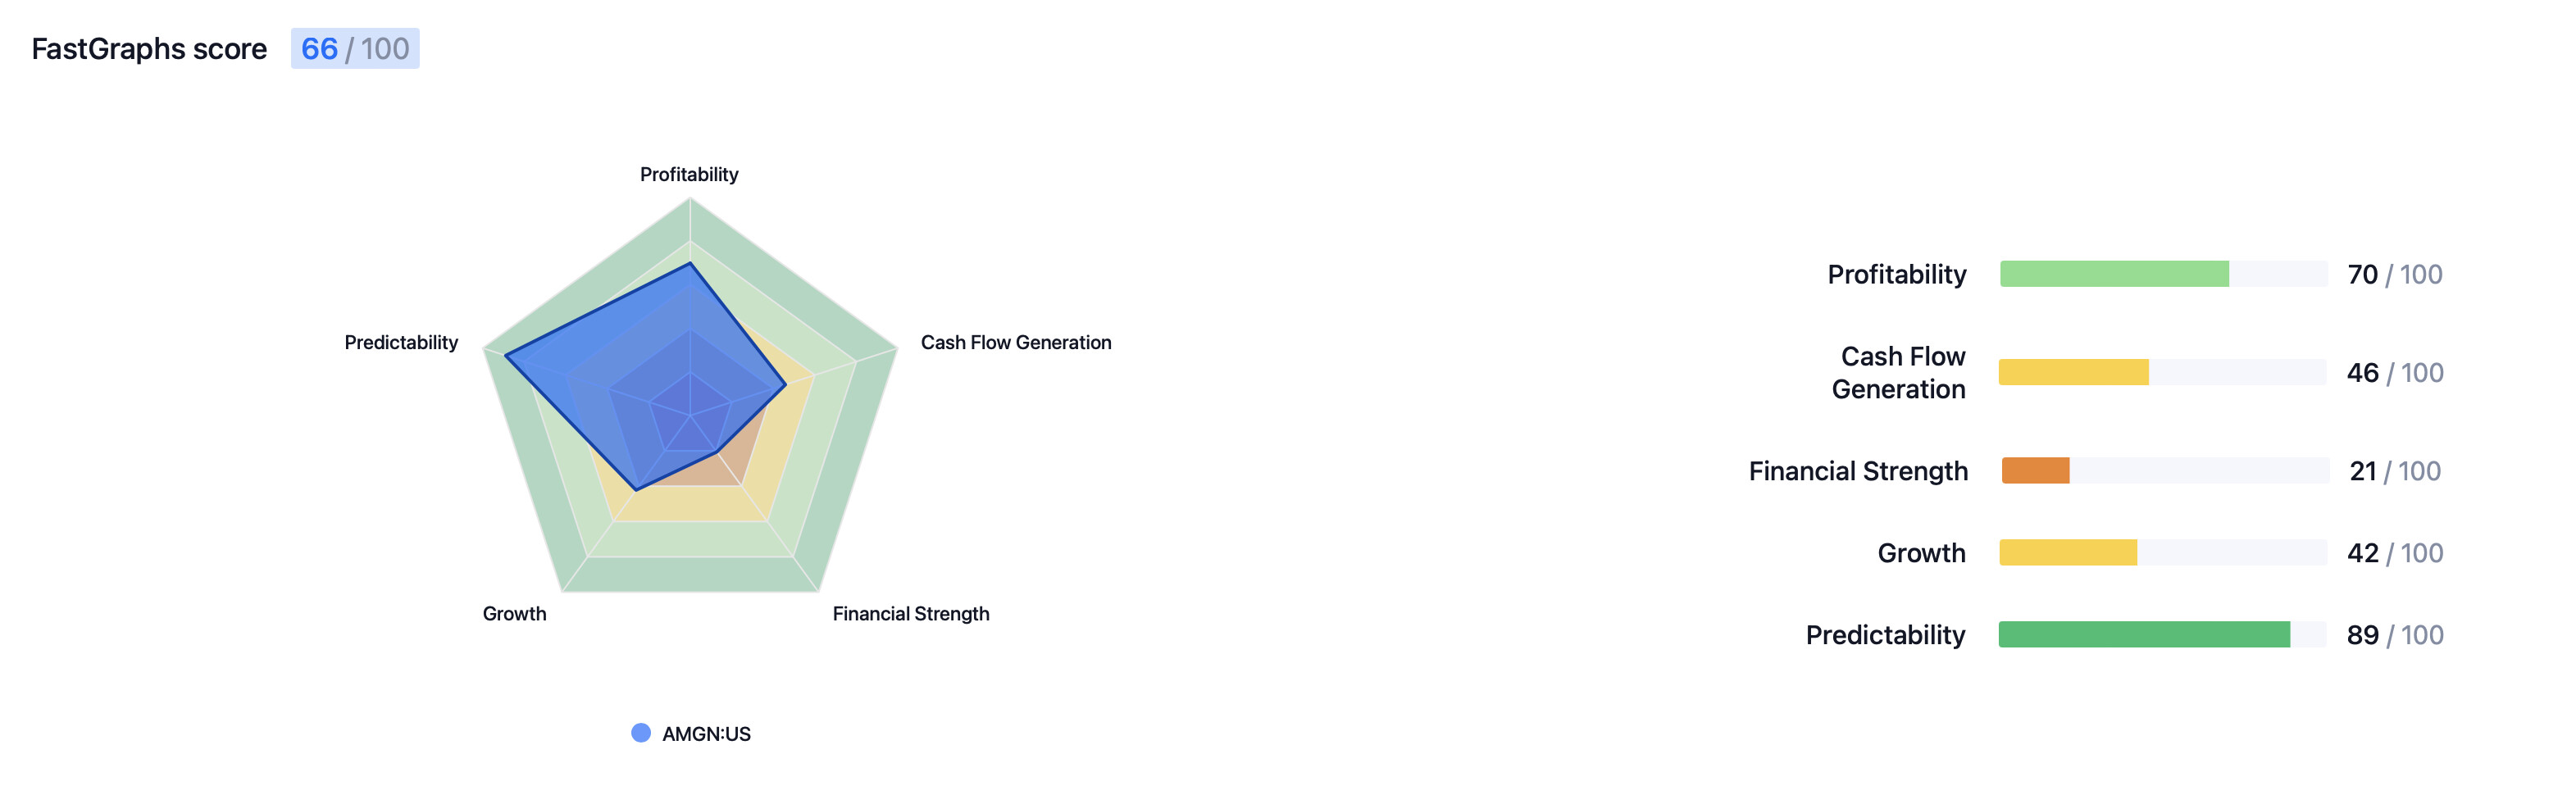
FASTgraphs score:

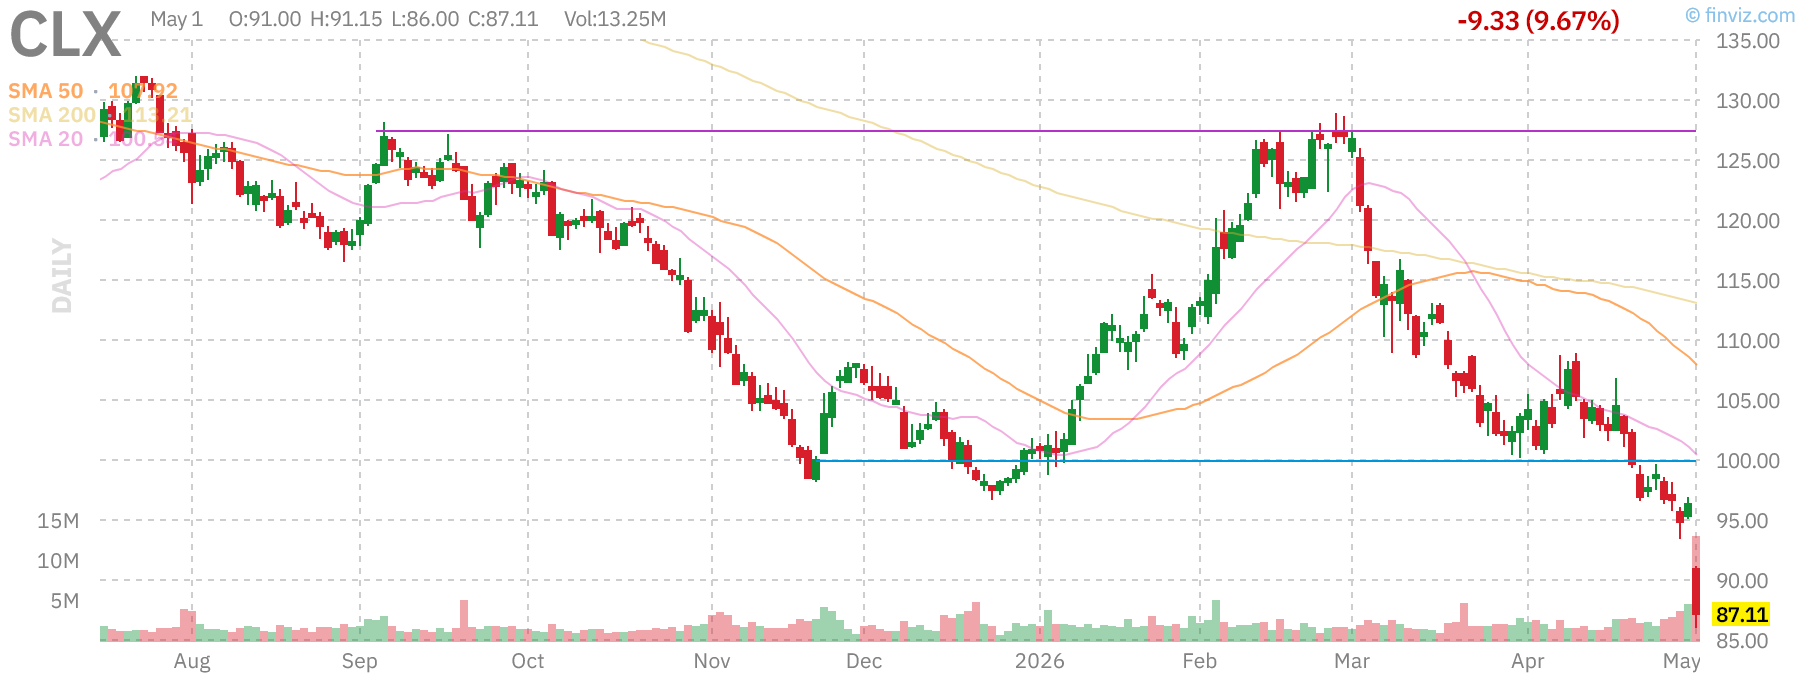
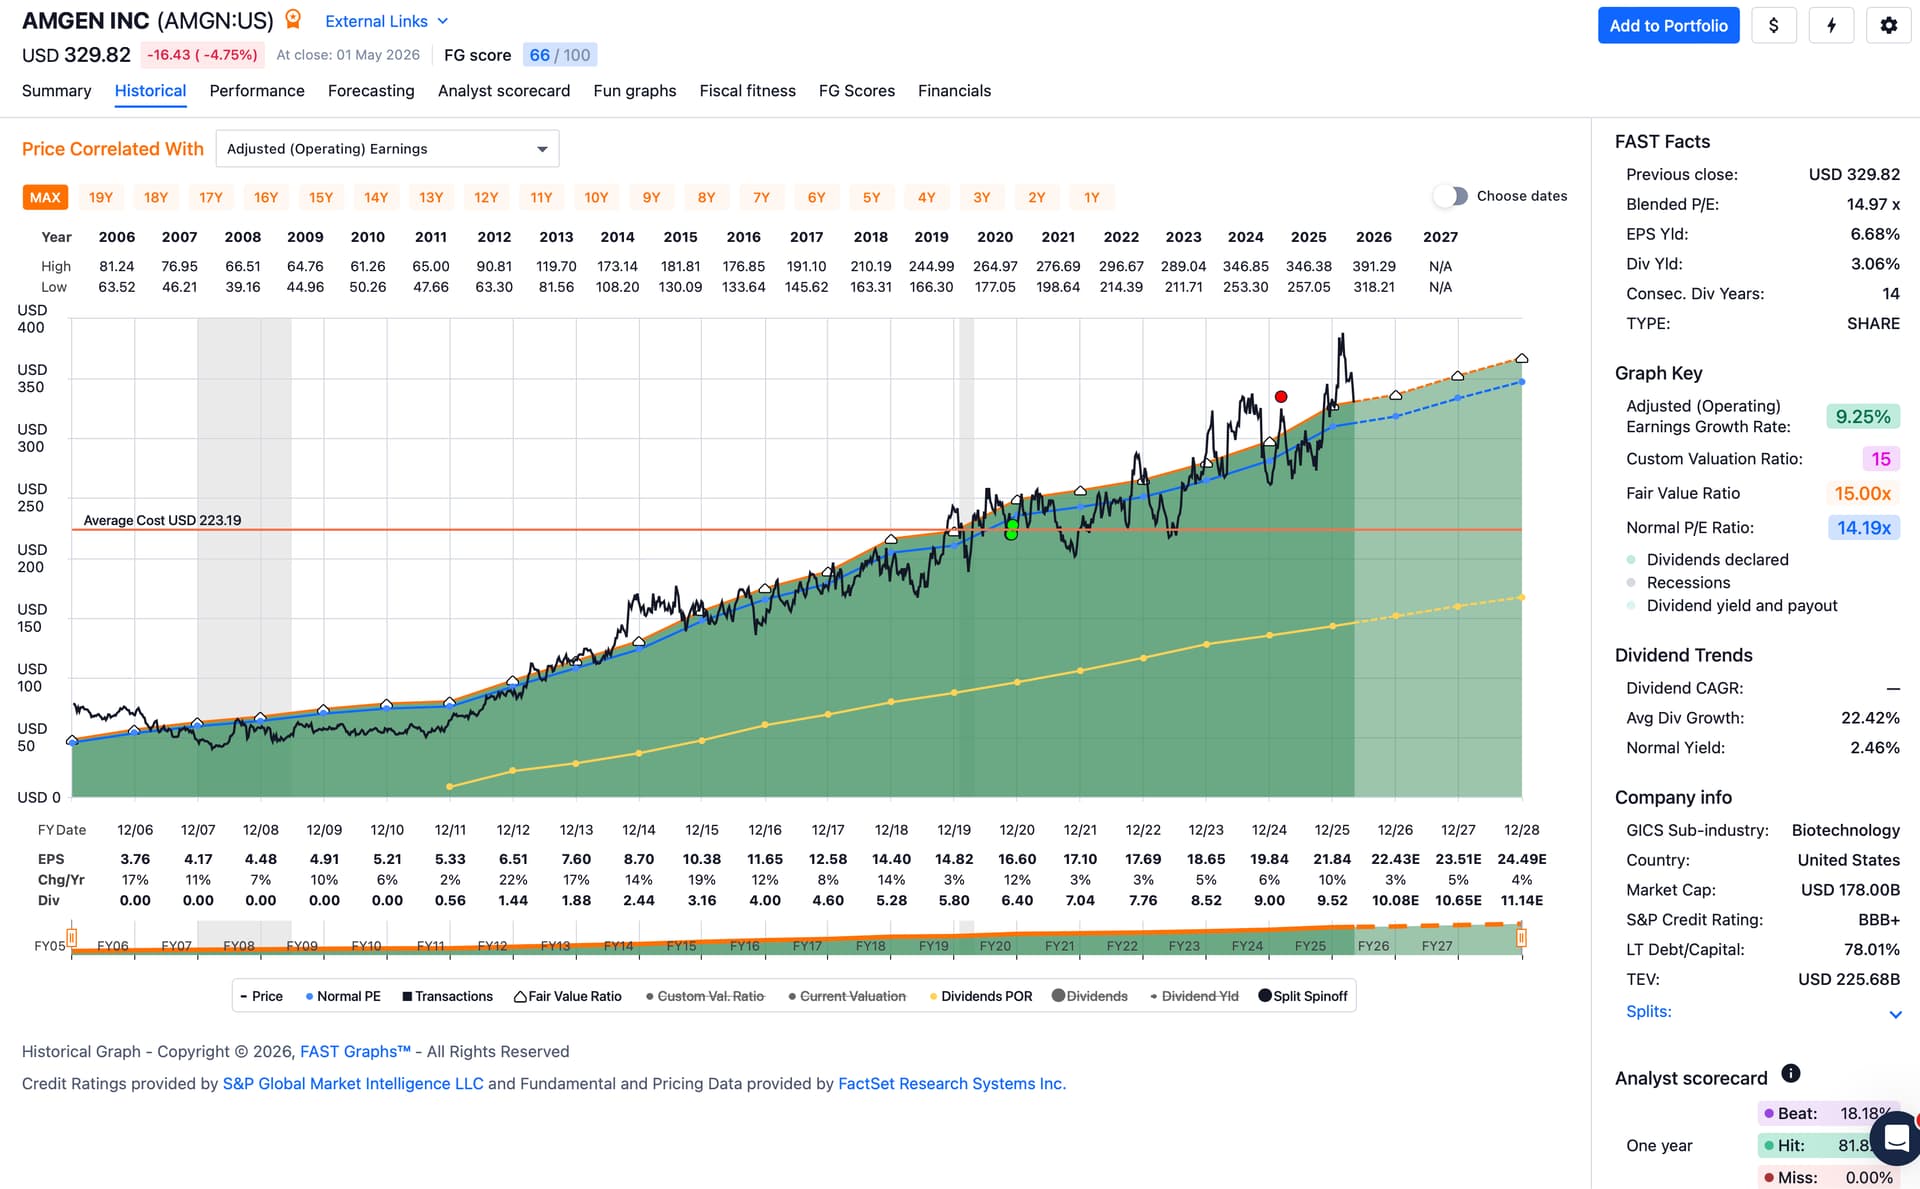
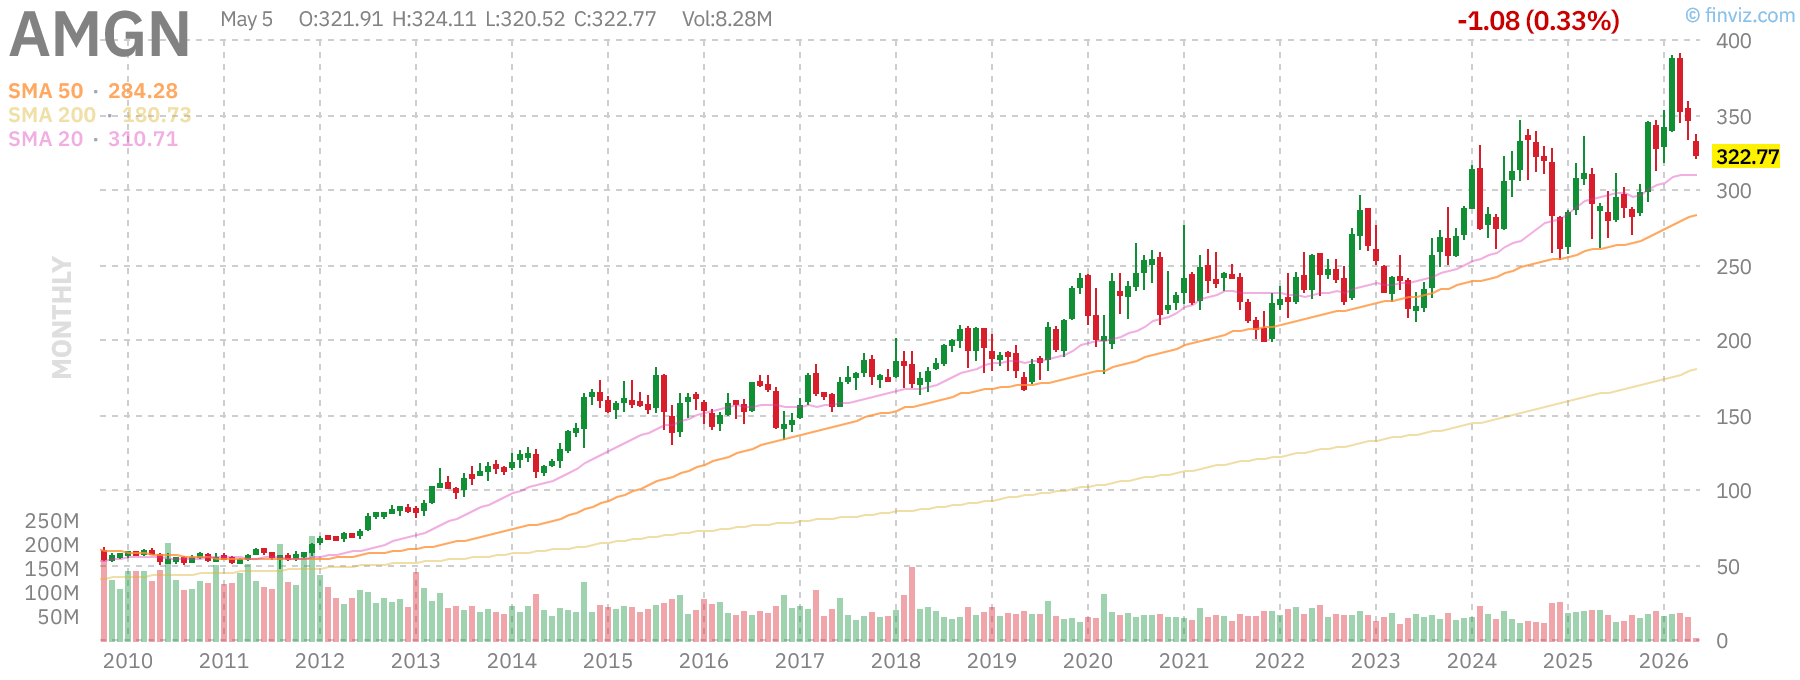
Historical earnings graph, price chart, etc:

Steadily growing earnings at a nice clip of ~10%, stellar dividend CAGR of ~20% since they initiated one, 14 years of consecutive and rising dividends.

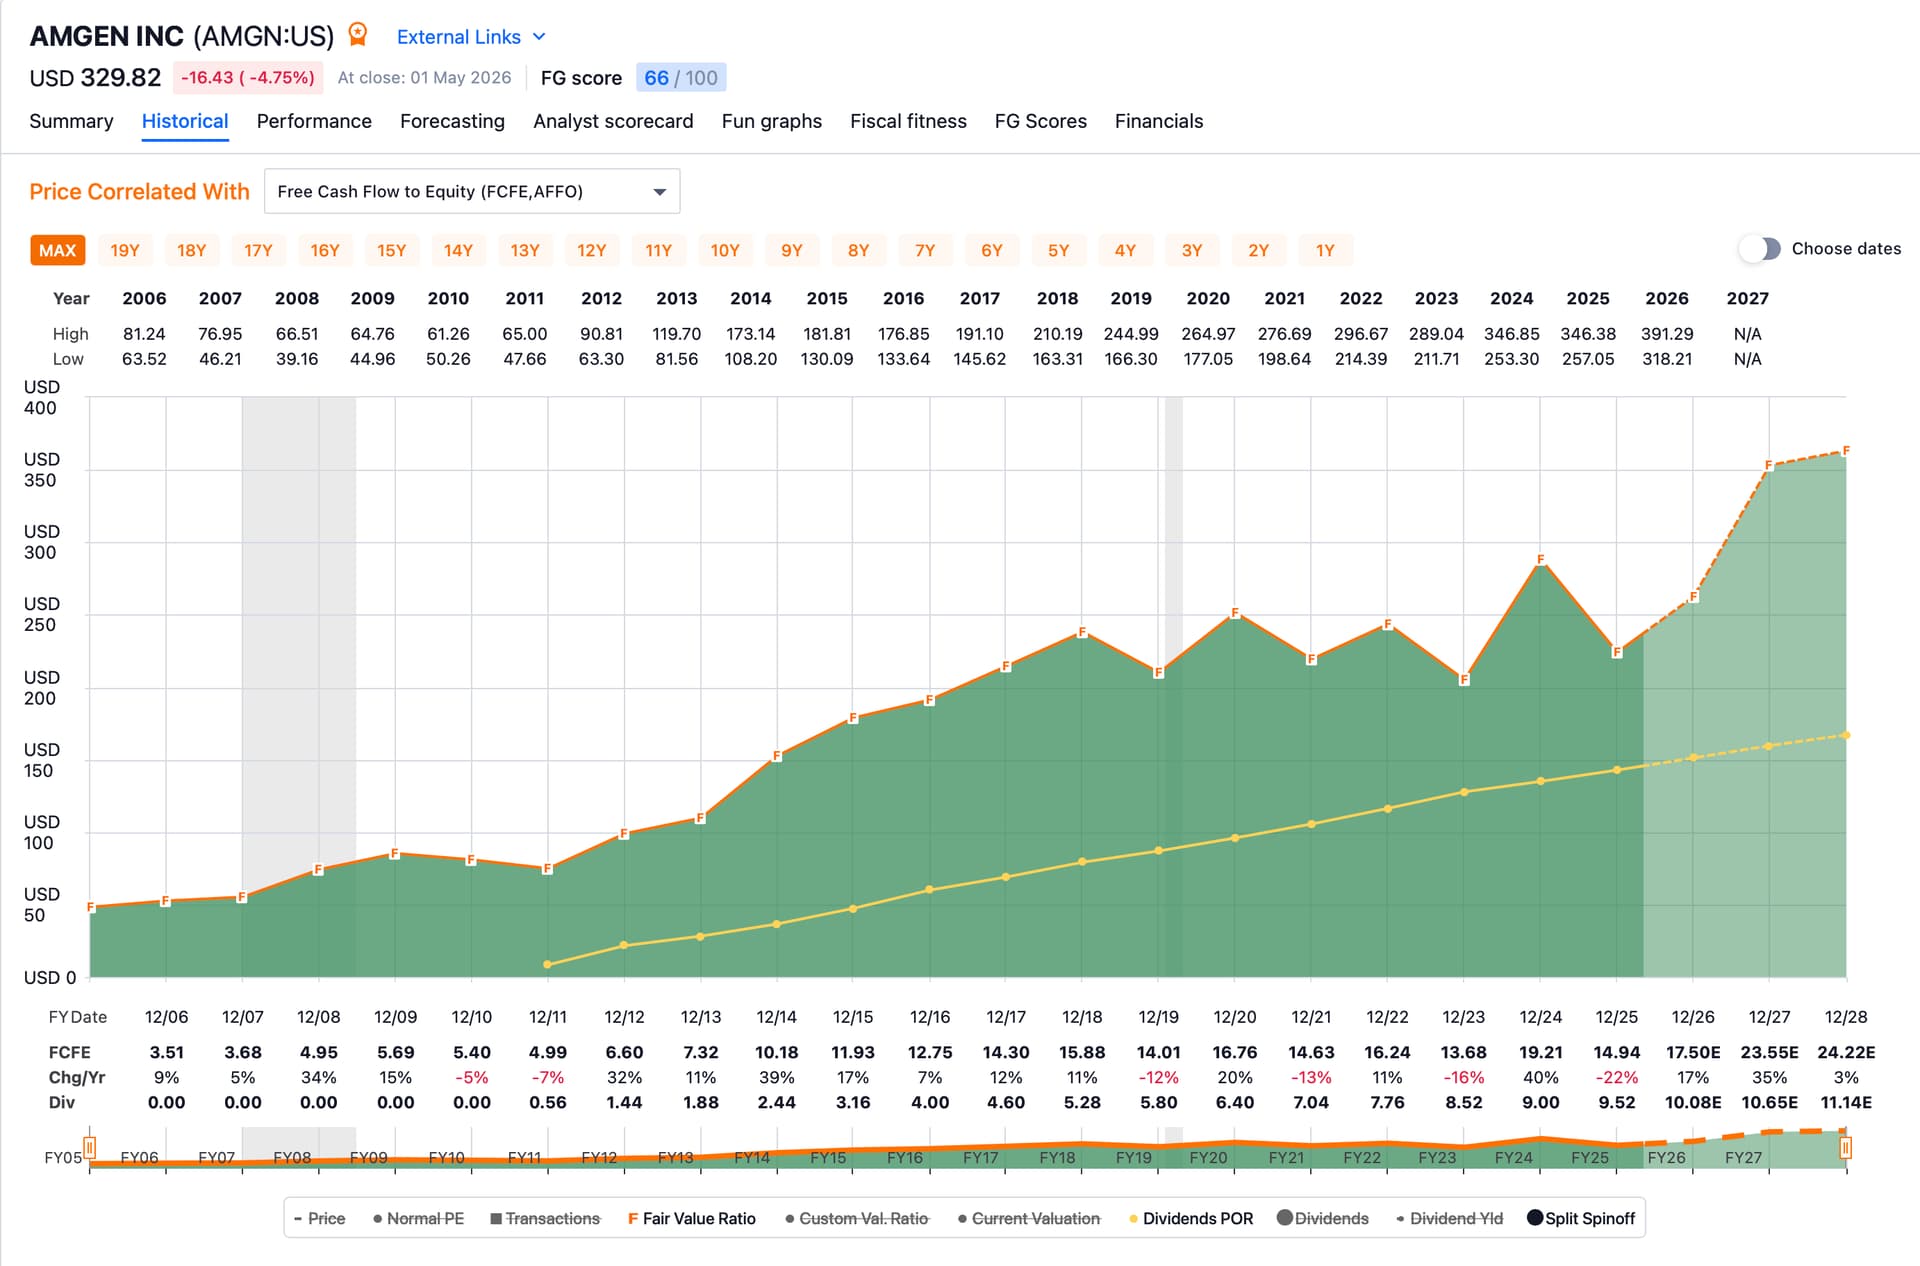
Free Cash Flow is similarly strong:

High on long term debt, but great BBB+ credit rating. Their strong cash flow easily allows them to service their debt.

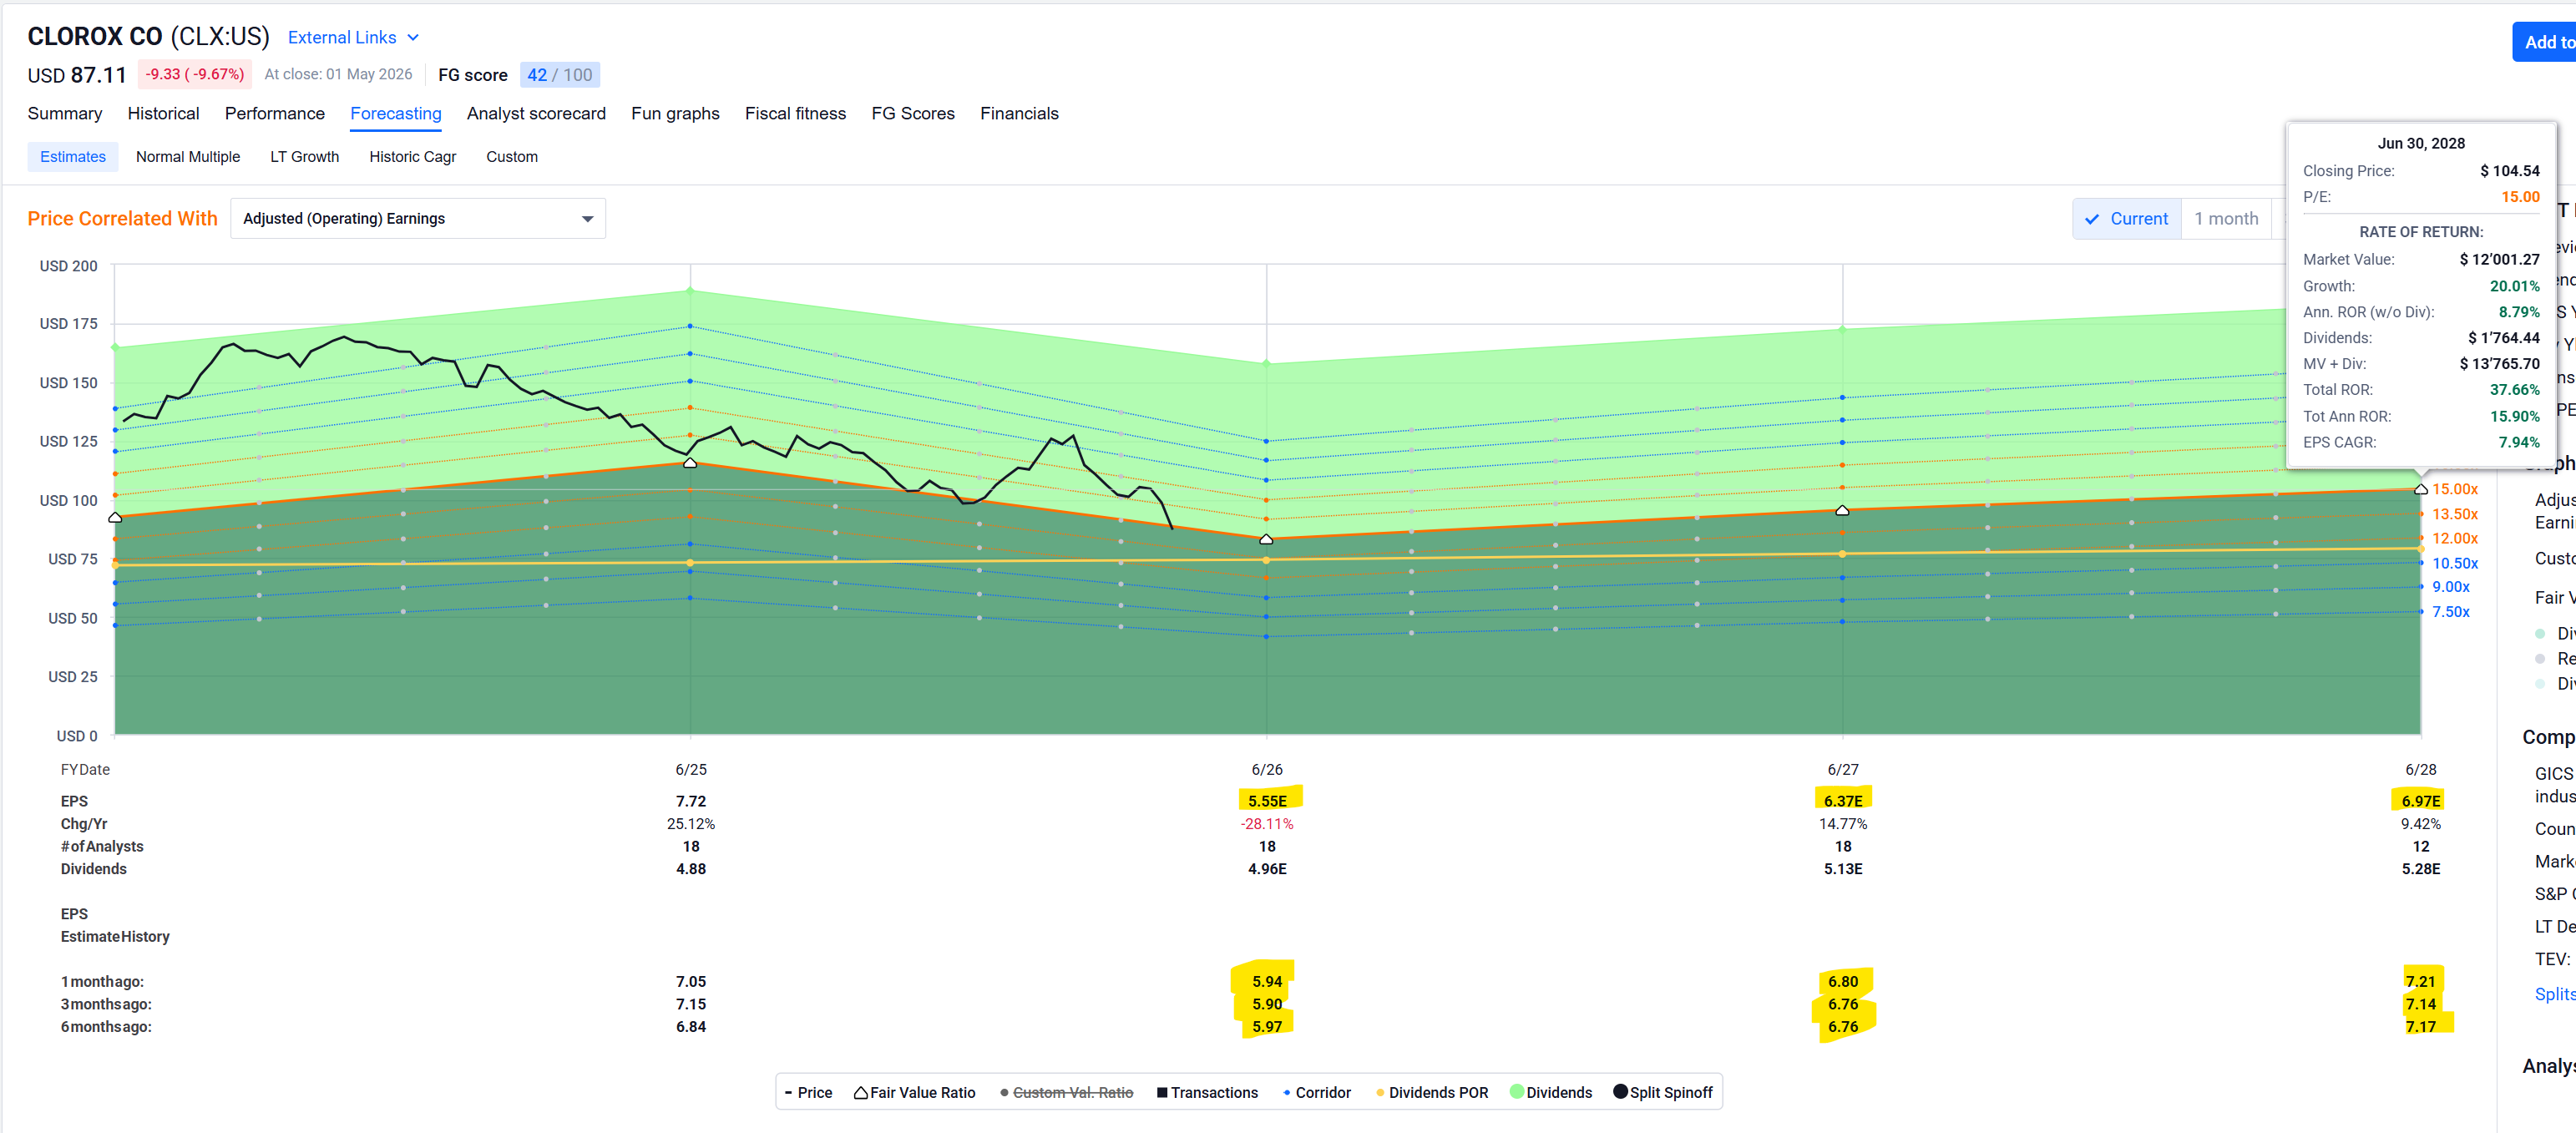
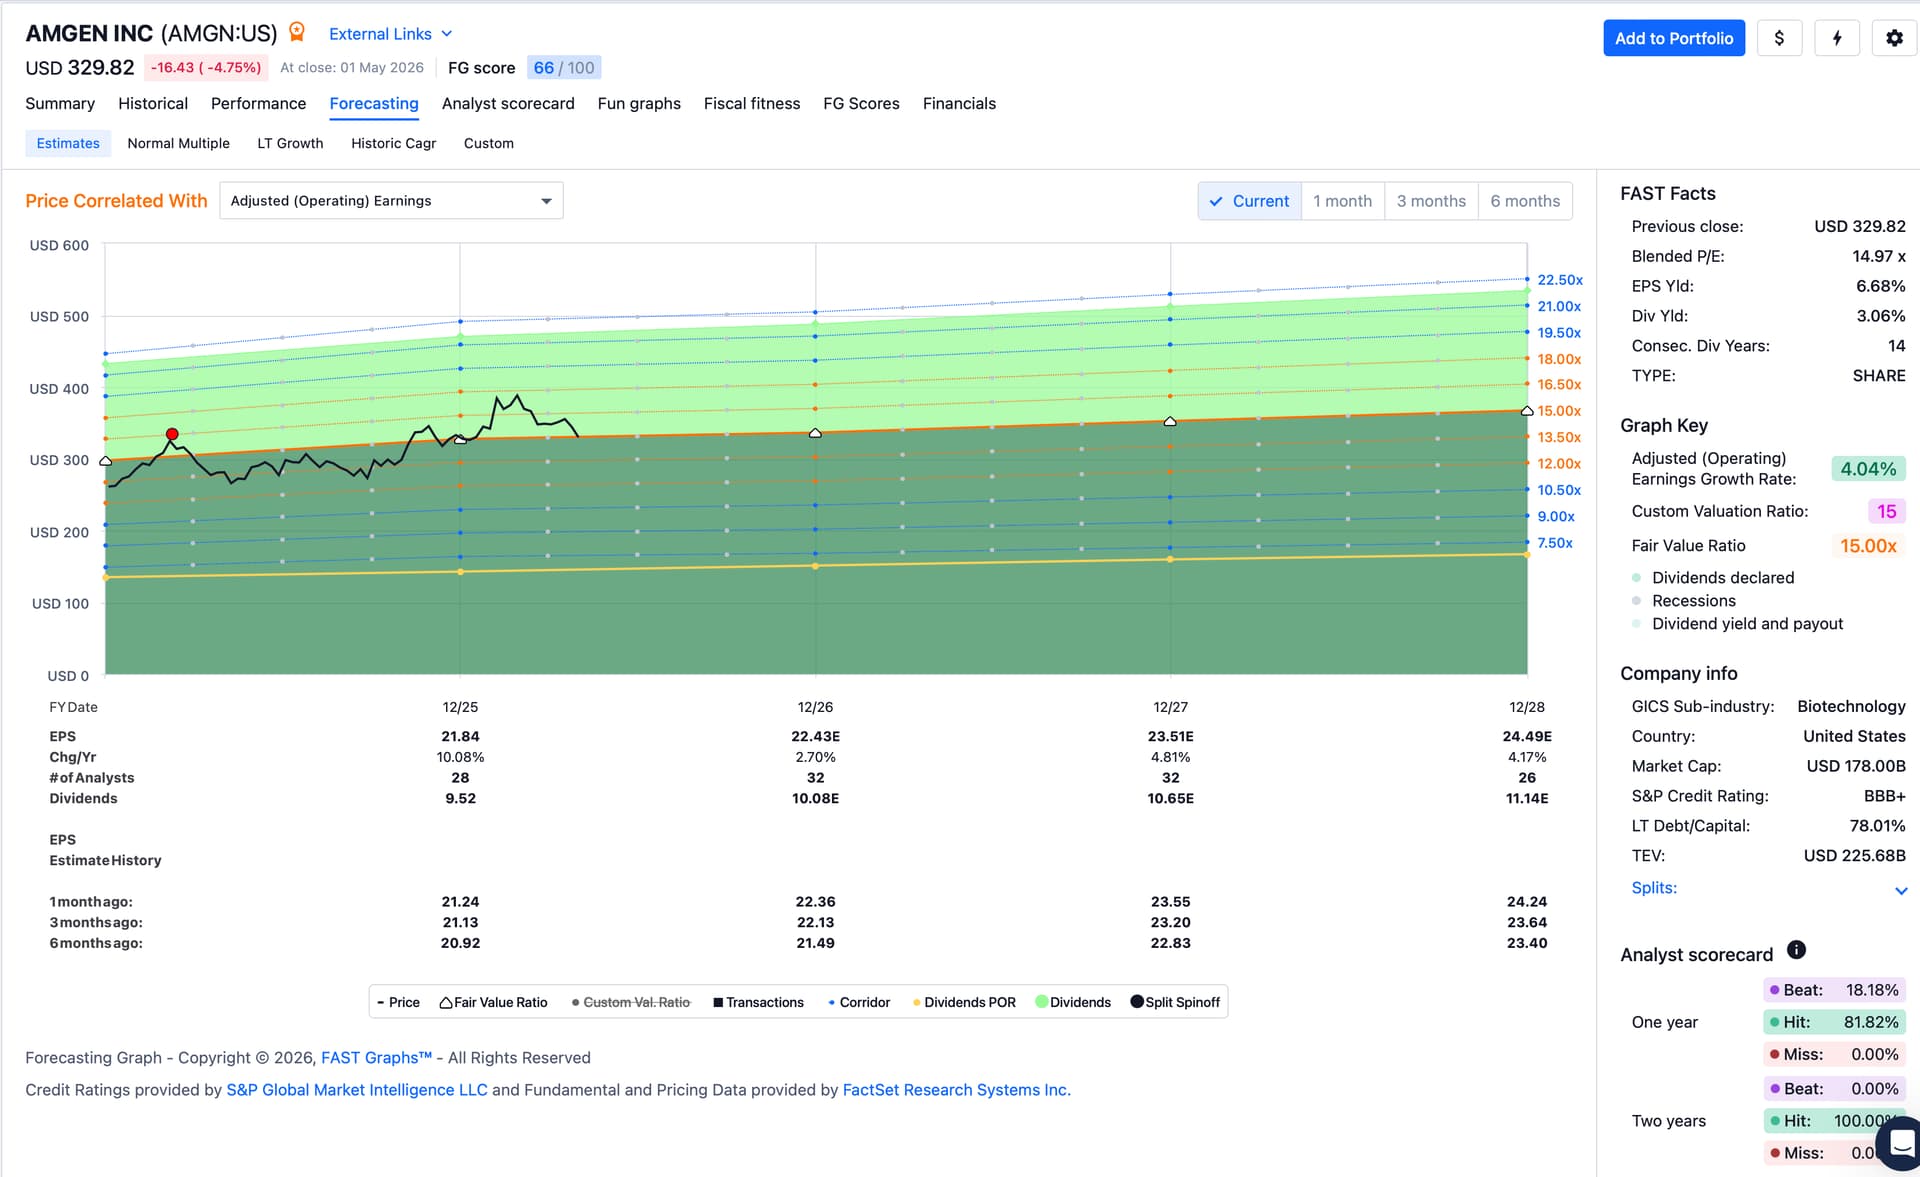
Forward looking earnings:

They’re just about fairly valued right now. As the chart indicates, they can be purchased below fair value regularly (and can be sold above fair value regularly as well). Price always stays pretty close to its normal valuation of around 14 x P/E.
Also visible on the chart above: AMGN never misses analyst estimates for earnings.

AMGN is one of my favorite positions. It’s already an almost full position, alas. If I loosened my risk management[$] this is a position that I’d grow a lot.

Currently a hold, but easily a buy if its PE dips below 14.


$ Company profile:

Company description:

Amgen, Inc. is a biotechnology company, which engages in the discovery, development, manufacture, and marketing of human therapeutics. The company was founded by William K. Bowes, Jr., Franklin Pitcher Johnson, Jr., George B. Rathmann, and Joseph Rubinfeld on April 8, 1980 and is headquartered in Thousand Oaks, CA.

GICS Information:

Health Care >Pharmaceuticals Biotechnology & Life Sciences >Biotechnology >Biotechnology

Company website:

http://www.amgen.com


$ Maximum position size is limited to contributing max 2% of all dividend income.

1 Like

Analysts may be wrong, but they may not be wrong alone…

Sorry, no deeper analyses at the moment, came back from a Fideuá.

Sorry for the delay, mucho fiesta en España. Finally found some time to check AMGN.

First it is a member of the Dow Jones U.S. Dividend 100 index. That is a very good thing because many mechanical checks are done to get included.

My parameters for the dividend strategy are fulfilled by the yearly data. However, the just published first quarter numbers look a bit worse, too little free cash flow for the enterprise value. That could be a seasonal or temporary problem and I would put the position on hold therefor at the moment. The valuation parameter I use is EV/FCF, I require it to be under 34 and it is currently at 37, not much of a problem.

The monthly chart looks like a dream, nothing but rise since 2012:

However, the daily chart looks not that good, but it seems to find a floor just now: