1. Competitive advantage — what is it, and how durable is it?
Sunrise’s advantage is primarily its Swiss telecom infrastructure, recurring subscription revenue, and customer relationships. Telecom networks are difficult and expensive to replicate, which creates some local scale and switching-cost benefits.
However, the financial data does not yet demonstrate a clearly durable economic moat:
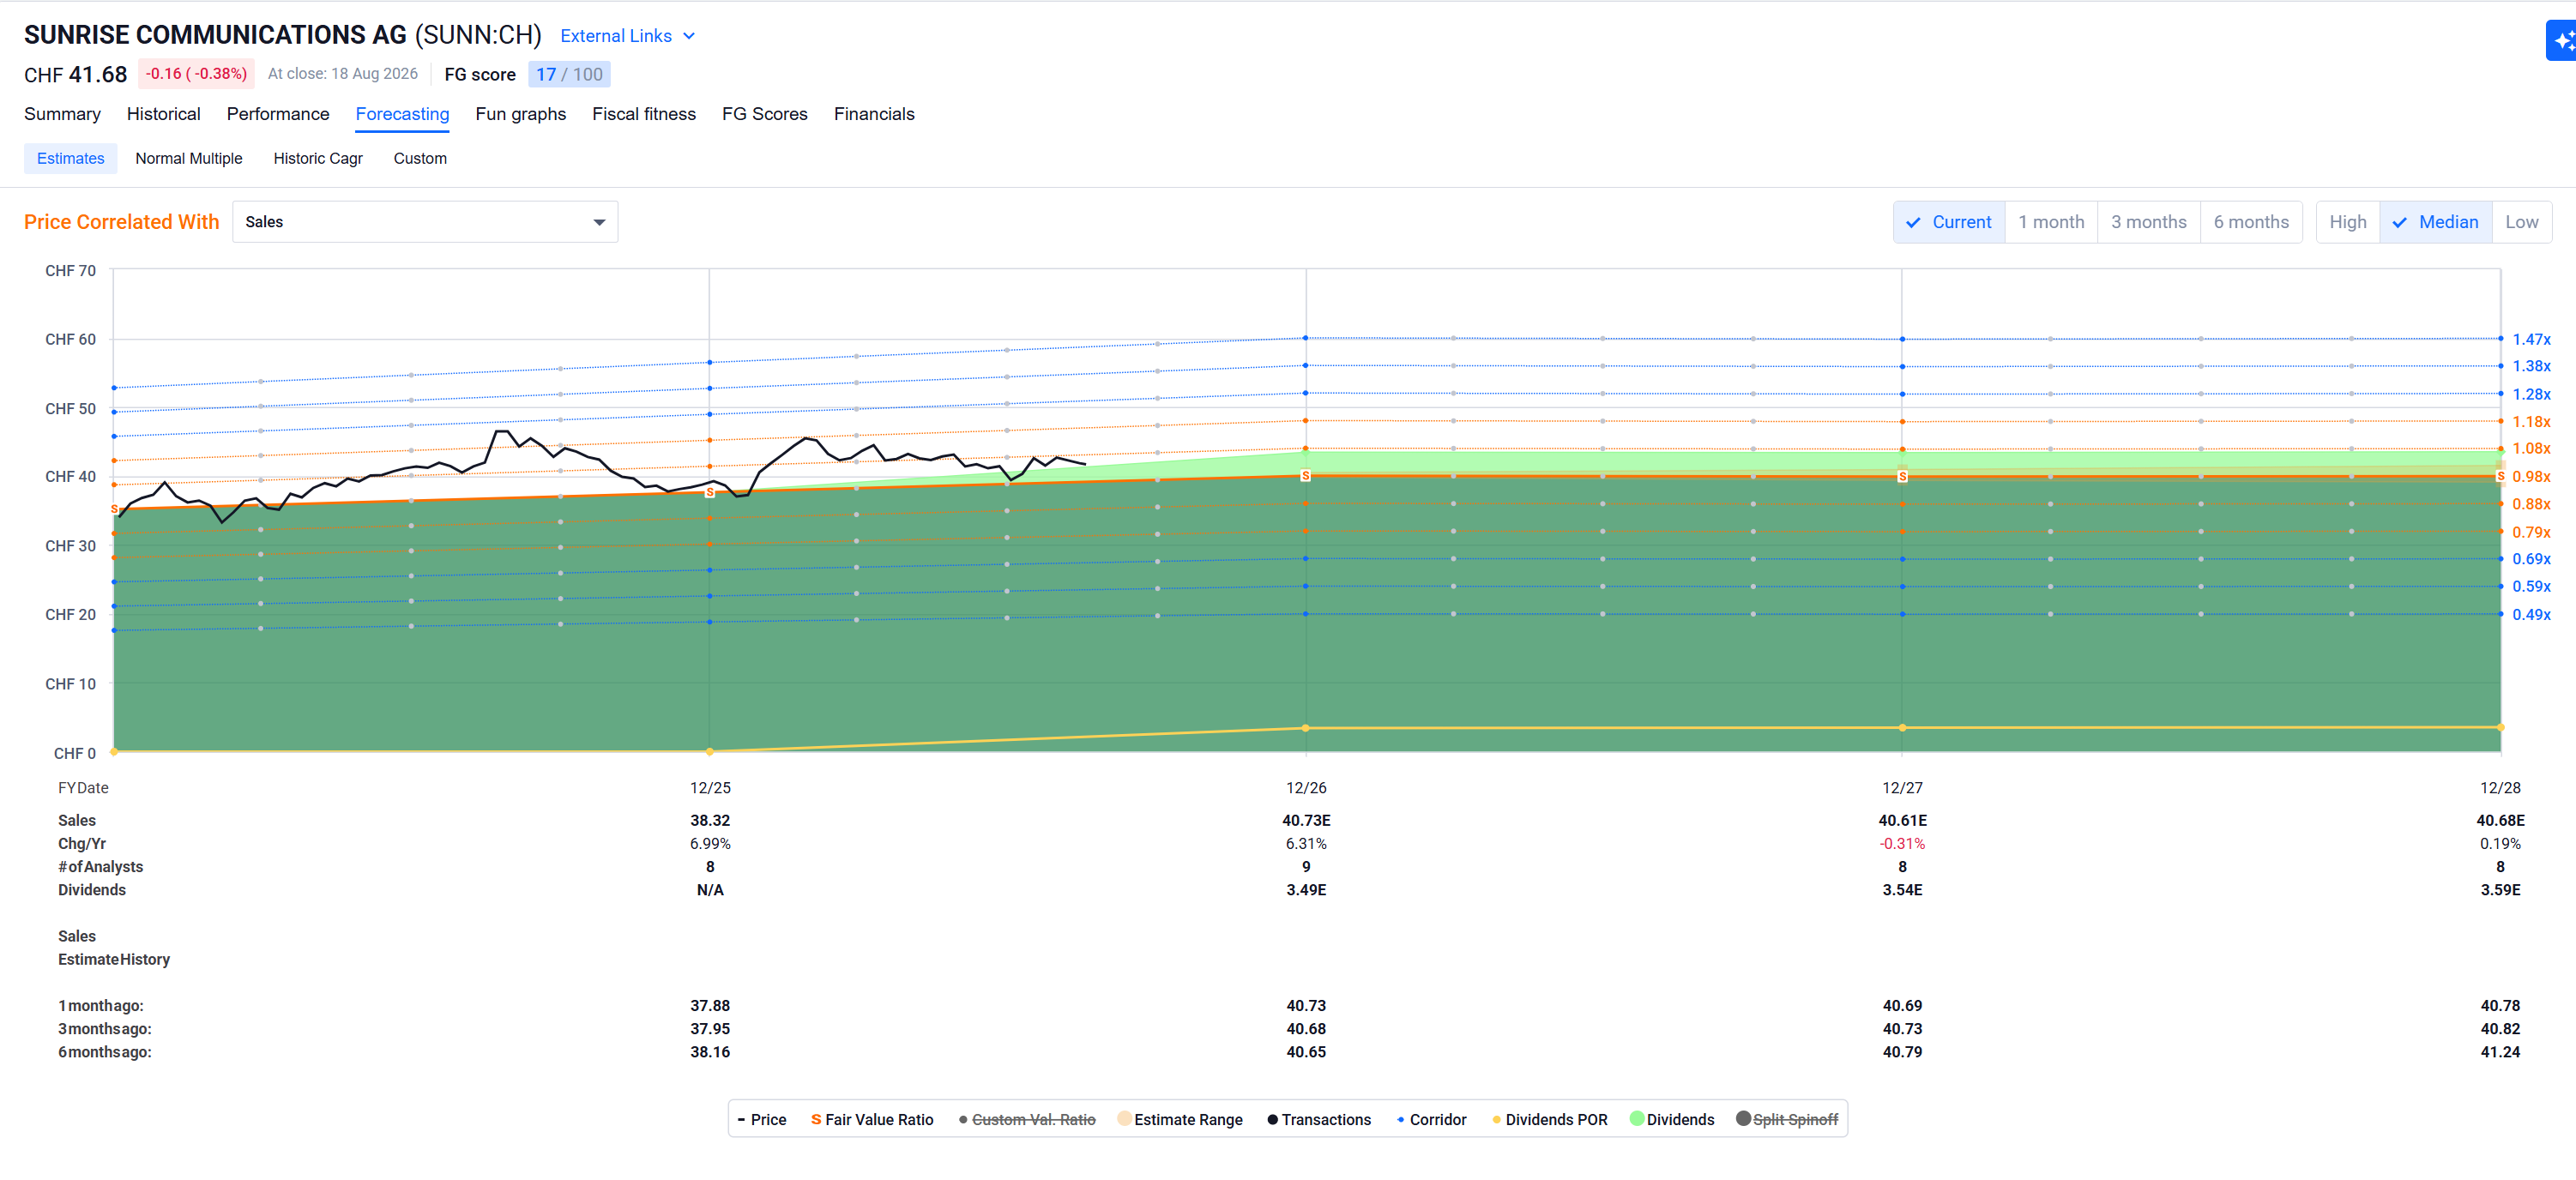
- Revenue has been essentially flat: CHF 3.04B in 2023, CHF 3.02B in 2024, CHF 2.98B in 2025, and CHF 2.98B LTM (
salesRevenue).
- Operating margin was only 0.2% in 2023, 1.3% in 2024, 1.3% in 2025, and 3.2% >LTM (
ebitOperatingIncome / salesRevenue).
- Net income remained negative: –CHF221M in 2023, –CHF366M in 2024, –CHF112M in 2025, and –CHF151M LTM (
netIncome).
The improvement in operating profit is encouraging, but the combination of flat sales, low operating margins, and recurring net losses suggests that the network advantage is being absorbed by high depreciation, financing costs, competition, and/or restructuring effects. I would call the advantage real but only moderately proven as durable.
2. Balance sheet — can they survive a downturn?
The balance sheet is the largest concern.
Debt
Debt has improved, but remains substantial:
- Total debt: CHF 6.55B at year-end 2024, CHF 5.61B at year-end 2025, and CHF5.68B LTM (
totalDebt).
- Net debt: CHF 6.20B in 2024, CHF 5.34B in 2025, and CHF5.53B LTM (
netDebt).
- Long-term debt excluding leases was CHF3.95B LTM (
longTermDebtExclLeaseObligations).
The headline leverage ratios are aggressive:
- Long-term debt/equity: 125.9% (
ltDebtToEquity)
- Long-term debt/capital: 52.1% (
ltDebtToCapital)
The company does have meaningful shareholder equity—CHF4.01B LTM (totalShareholdersEquity)—but tangible book value is deeply negative at approximately –CHF2.82B (bookValuePerShareTangible, gross value). That is typical of highly leveraged telecom businesses with substantial acquired intangible assets, but it leaves limited tangible balance-sheet protection.
Liquidity and coverage
Liquidity is thin:
- Current ratio: 0.62
- Quick ratio: 0.57
- Cash: only CHF152M LTM (
cashOnly)
- Current assets: CHF847M versus total assets of CHF11.52B (
totalCurrentAssets, totalAssets)
Cash flow currently provides the main defense:
- LTM operating cash flow was CHF908.5M (
netOperatingCashFlow).
- LTM capital expenditures were CHF390.6M (
capitalExpendituresTotal).
- That implies roughly CHF517.9M of operating free cash flow before financing.
Coverage is therefore acceptable in the normal operating case, but a downturn would matter. The most recent quarter deteriorated sharply: Q1 2026 showed –CHF25M of operating cash flow and –CHF163M of free cash flow, partly because of a CHF186M working-capital outflow (netOperatingCashFlow, freeCashFlowToEquity, changesInWorkingCapital). The earlier quarters were much stronger, so this may be timing-related—but it shows that quarterly cash generation can be volatile.
Verdict: survivable if cash flow remains near the LTM level, but not a fortress. Debt refinancing, interest costs, and a sustained decline in operating cash flow are important risks.
3. Management quality — good execution or good luck?
There are some positive capital-allocation signals:
- Debt fell by roughly CHF940M from year-end 2024 to year-end 2025.
- LTM net debt remains about CHF670M lower than at year-end 2024.
- Capital expenditures were below depreciation: CHF391M of capex versus CHF1.04B of depreciation and amortization LTM (
capitalExpendituresTotal, depreciationAndAmortization).
That helped produce positive LTM free cash flow despite negative accounting earnings. The company also appears to have reduced SG&A from CHF754M in 2023 to CHF619M in 2025 (sellingGeneralAndAdministrativeExpense).
But the record is not clean enough to give management a high score:
- Net income has been negative for every reported annual period supplied.
- ROE is –3.7% (
returnOnEquity).
- The reported ROIC of 75.0% (
returnOnInvestedCapital) looks unusually high and is likely distorted by the company’s capital structure, accounting base, or unusual operating-period effects. It should not be interpreted as evidence of a 75% sustainable return.
- The latest LTM net loss is CHF151M, despite positive operating cash flow.
- Shares outstanding increased from roughly 71.5M in Q1 2025 to 72.8M in Q1 2026 (
totalSharesOutstanding), so investors should monitor dilution.
Verdict: management has shown useful deleveraging and cost control, but the evidence is mixed. The results look partly like genuine operational improvement and partly like a leveraged turnaround whose success still depends on maintaining cash flow.
4. Valuation versus growth prospects
Traditional P/E valuation is currently unusable because earnings are negative:
- The current blended P/E is not meaningful (
blended_eps_pe).
- EPS was –CHF3.05 in 2023, –CHF5.07 in 2024, and –CHF1.56 in 2025 based on the chart and reported
epsFullyDiluted.
- The LTM EPS figure is still negative at approximately –CHF2.08 (
epsFullyDiluted, per share).
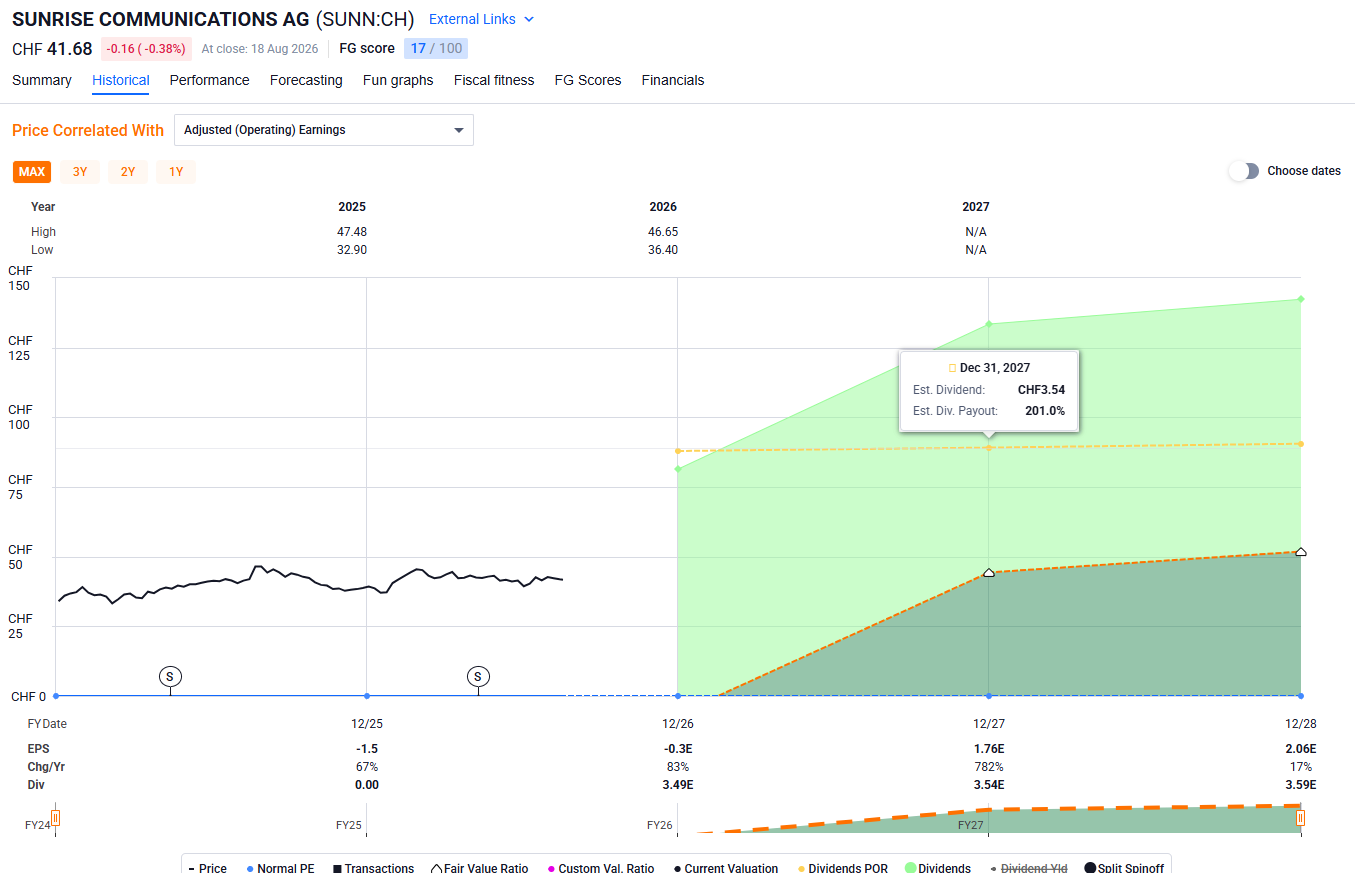
The forward case depends on a substantial earnings recovery. The chart shows estimated EPS of approximately:
- –CHF0.26 in 2026
- CHF1.76 in 2027
- CHF2.06 in 2028
At a share price of CHF41.68 (current_price), that would represent roughly:
- 24× 2027 estimated EPS
- 20× 2028 estimated EPS
That is not obviously cheap if revenue remains flat and operating margins remain low. On the other hand, the data’s forward valuation model says the shares trade approximately 78.8% below forward fair value (forward_valuation). That is a model-based estimate, not a guarantee; it appears to assume a successful earnings normalization.
The key valuation tension is:
- Positive: debt reduction, improving operating margins, strong LTM cash flow, and a potential return to positive EPS.
- Negative: flat revenue, negative current earnings, high leverage, negative tangible book value, and a very weak recent share-price trend—–64.1% LTM (
price_returns_ltm).
Verdict: potentially attractive as a turnaround, but not plainly cheap on current earnings. The valuation works only if the 2027–2028 earnings recovery materializes.
5. Risks — what could go wrong?
The main risks are:
- Debt and refinancing risk. Net debt of CHF5.53B is large relative to the company’s roughly CHF3.0B of annual revenue and CHF909M of LTM operating cash flow.
- Low liquidity. A 0.62 current ratio, 0.57 quick ratio, and only CHF152M of cash leave limited room for a prolonged operating shock.
- Weak earnings quality or high financing burden. Operating cash flow is positive, but accounting earnings remain negative. LTM net income was –CHF151M, while LTM OCF was CHF909M. The gap may reflect noncash depreciation and other items, but it should not be assumed to be permanently benign.
- Quarterly cash-flow deterioration. The latest quarter had –CHF25M OCF, with a CHF186M working-capital outflow. If that weakness persists beyond timing effects, debt reduction could slow or reverse.
- Competitive pressure and flat demand. Revenue fell from CHF3.04B in 2023 to CHF2.98B LTM, so the company has not yet shown strong top-line momentum.
- Capital-intensity risk. Capex was below depreciation recently, which supports cash flow, but underinvesting in network quality could eventually damage competitiveness. Conversely, a capex catch-up would reduce free cash flow.
- Dividend sustainability and data uncertainty. The dividend yield is shown as 8.2% (
fg_current_dividend_yield), a level that often signals elevated risk. The dividend history shows CHF3.33 per share in 2024 and CHF3.42 in 2025, but the cash-flow statement reports zero cash dividends paid in 2024 and 2025 (cashDividendsPaid). That inconsistency should be resolved before relying on the headline yield.
6. Dividend coverage
Sunrise does pay a dividend according to the dividend history:
- CHF3.33 per share in 2024
- CHF3.42 per share in 2025
- The chart estimates roughly CHF3.49 per share for 2026
At approximately 72.8M shares, a CHF3.42 dividend would require about CHF249M of annual cash.
Against LTM cash flow:
- OCF coverage: CHF908.5M / CHF249M ≈ 3.6×
- Approximate post-capex coverage: CHF517.9M / CHF249M ≈ 2.1×
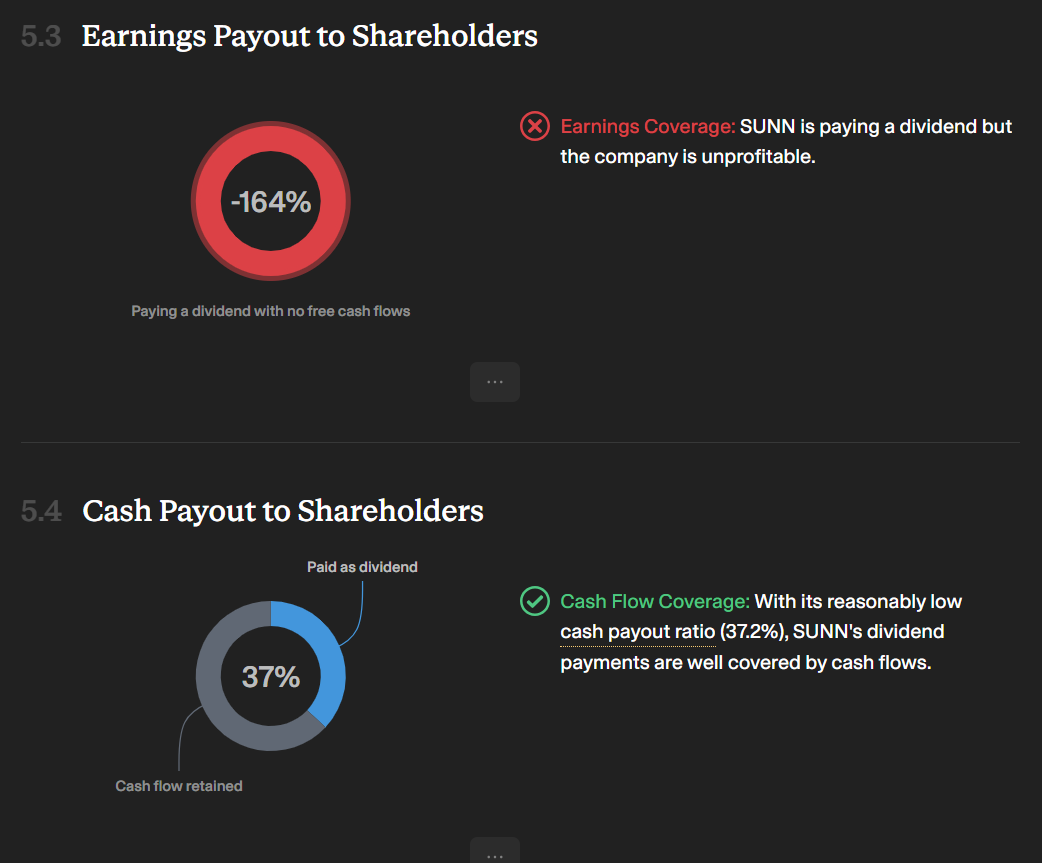
So, using the dividend history and LTM cash flow, the dividend appears covered by both operating cash flow and free cash flow.
However, there are two important qualifications:
- The latest quarter produced negative free cash flow of CHF163M.
- The reported cash-flow statement shows CHF0 of cash dividends paid, despite the dividend-history data showing distributions. The event is also labeled “Dividend payable from reserves or sale of assets” and marked as a spinoff-related event, so the cash-flow classification may not be directly comparable.
Bottom line: Sunrise looks like a leveraged, cash-generative telecom turnaround—not a low-risk income stock. The thesis depends on continued debt reduction, stable operating cash flow, and a return to positive EPS. The dividend is numerically covered on an LTM basis, but the unusually high yield, weak liquidity, negative earnings, and inconsistent dividend-payment data make it unsuitable to treat as a conventional “safe” dividend payer.



 )
) I’m happy to not collect a 2-4-6% dividend on such an appreciation path. It’ll go as long as it’ll go…